GENERATING VISUAL REPRESENTATIONS OF DATA TO CONVEY PATTERNS, TRENDS, AND INSIGHTS

VISUALIZATION LAB
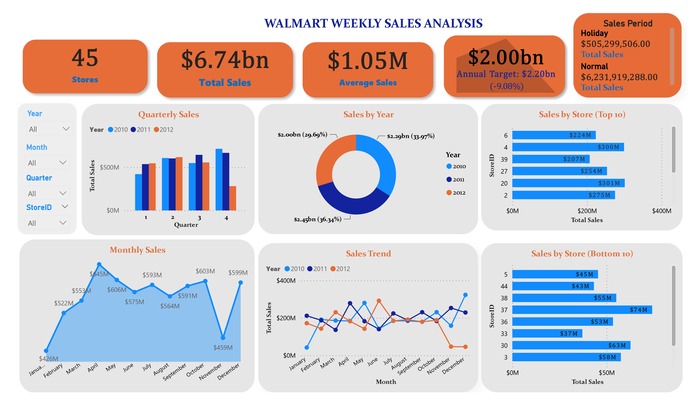
Walmart Weekly Sales Analysis:
Visualization with PowerBI
This analysis presents key insights from Walmart's weekly sales data, specifically from 2010 to 2012. The data is visualized using PowerBI, offering an in-depth look at Sales performance, trends, and other significant patterns.
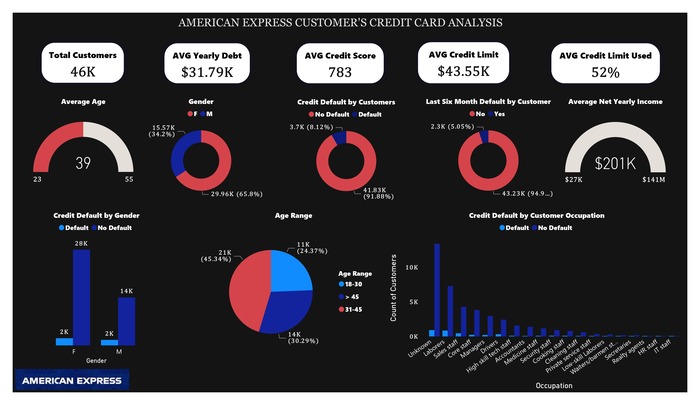
American Express Customer’s Credit Analysis:
EDA with PowerBI
This analysis presents key insights from American Express customer credit data, visualized using PowerBI. The data provides an in-depth look at customer demographics, financial profiles, credit insights, and other significant information.